At the May 2026 meeting of the One Place Study Group at the Society of Australian Genealogists one of the group showed the results of some social network analysis of her data using Gephi.
I decided to experiment to see what network diagrams I could generate using the Gephi Lite version and either the Geojson or the CSV file I already have for producing the maps on this site. Once again I used Comet/Perplexity as in order to use Gephi Lite I needed to have my data in a .gexf format. Perplexity gave me an R script that I could run on my CSV file to produce the requisite .gexf format.
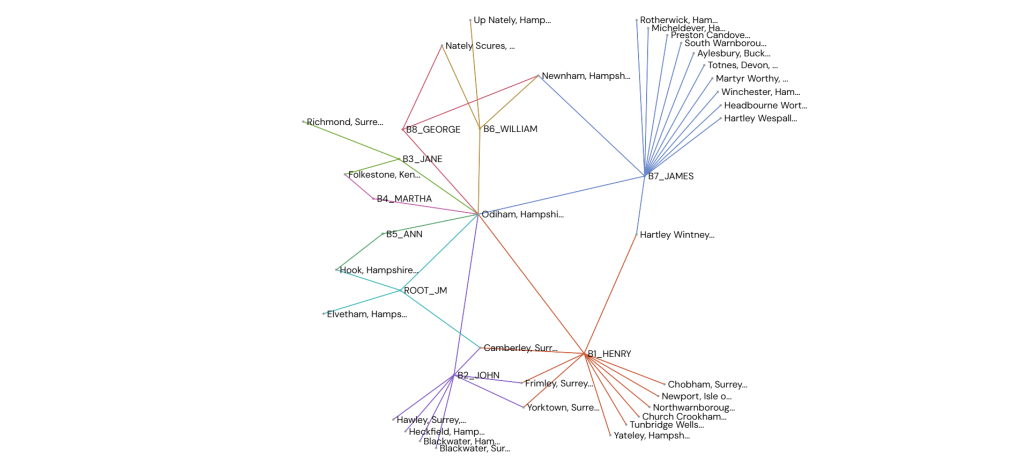
The diagram below is what resulted, with colour set to the branch id, edges coloured per the source node, and a layout style of ForceAtlas2.
There is still a fair bit of data to add in, so I am not going to go any further with this for the time being, but this diagram reveals connections between the Bracknell siblings that aren’t immediately obvious from the maps, so its well worth the time to continue once the data is more complete.